Introduction
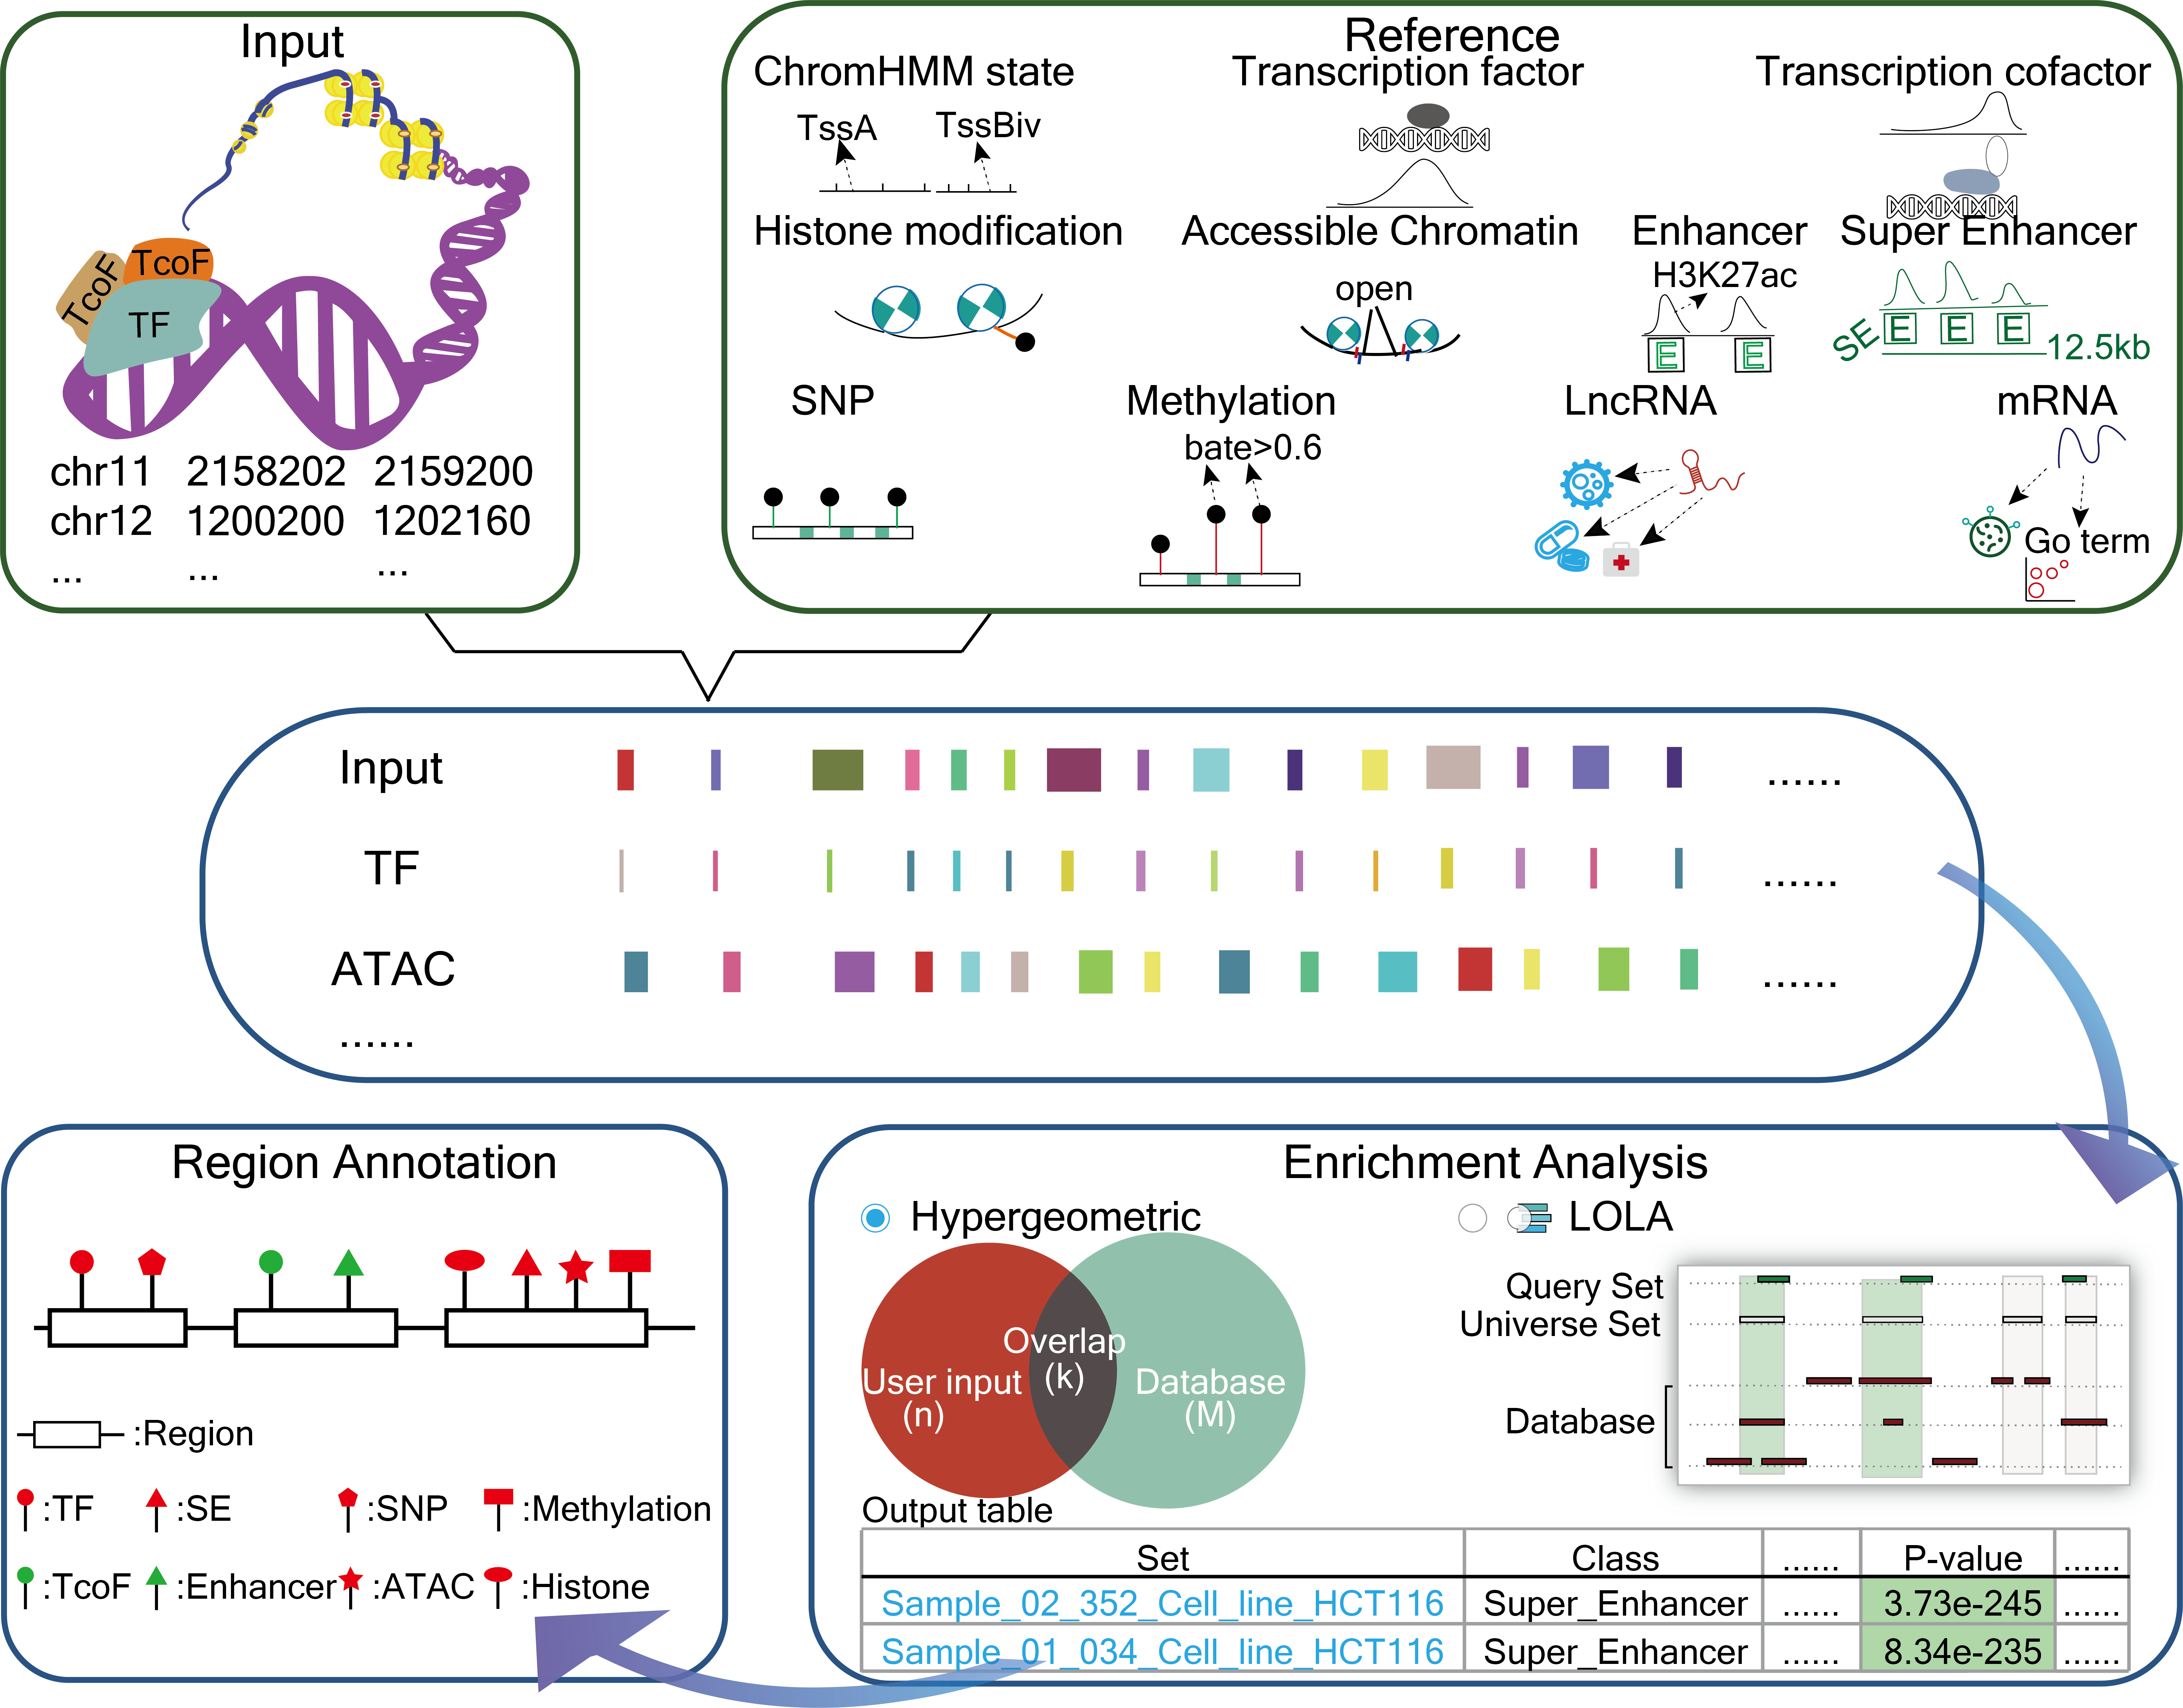
GREAP is a powerful platform that provides a variety of types of genome region sets for users and perform annotation and enrichment analysis of genome region sets based on genome region lists submited by users. GREAP integrated and classified various types of genome region collections. Importantly, based on these reference sets, GREAP provides two approaches for genomic region set annotation and enrichment analysis. GREAP also provides a user-friendly interface to search, browse and visualize detailed information about these genome region sets.
How to Use the GREAP?
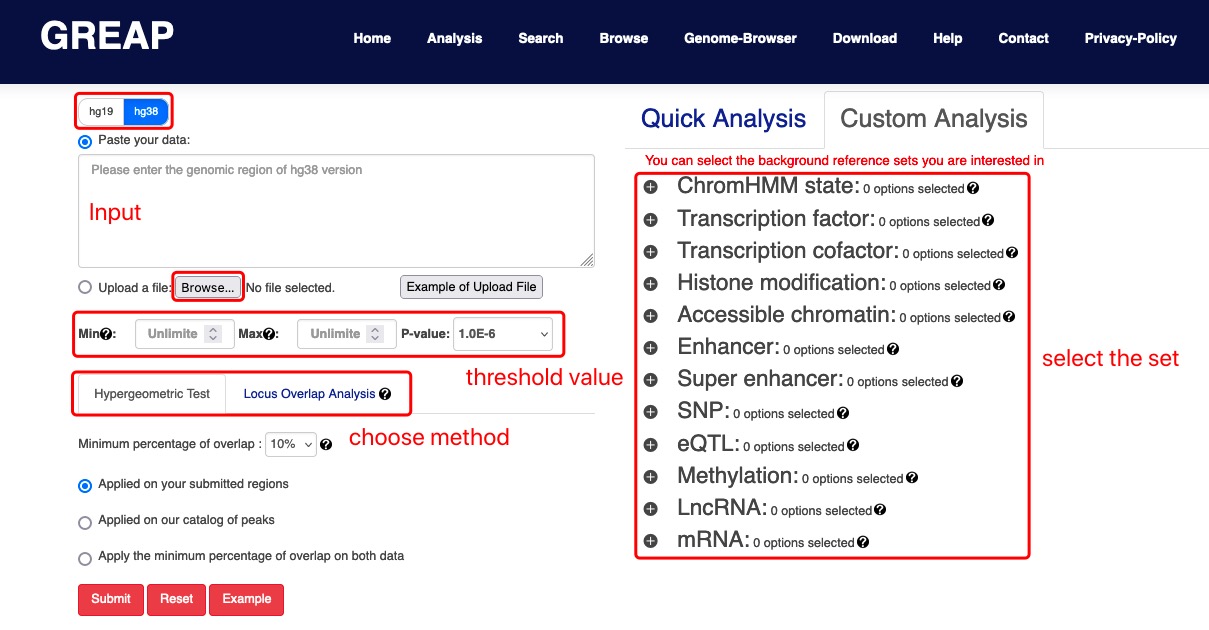
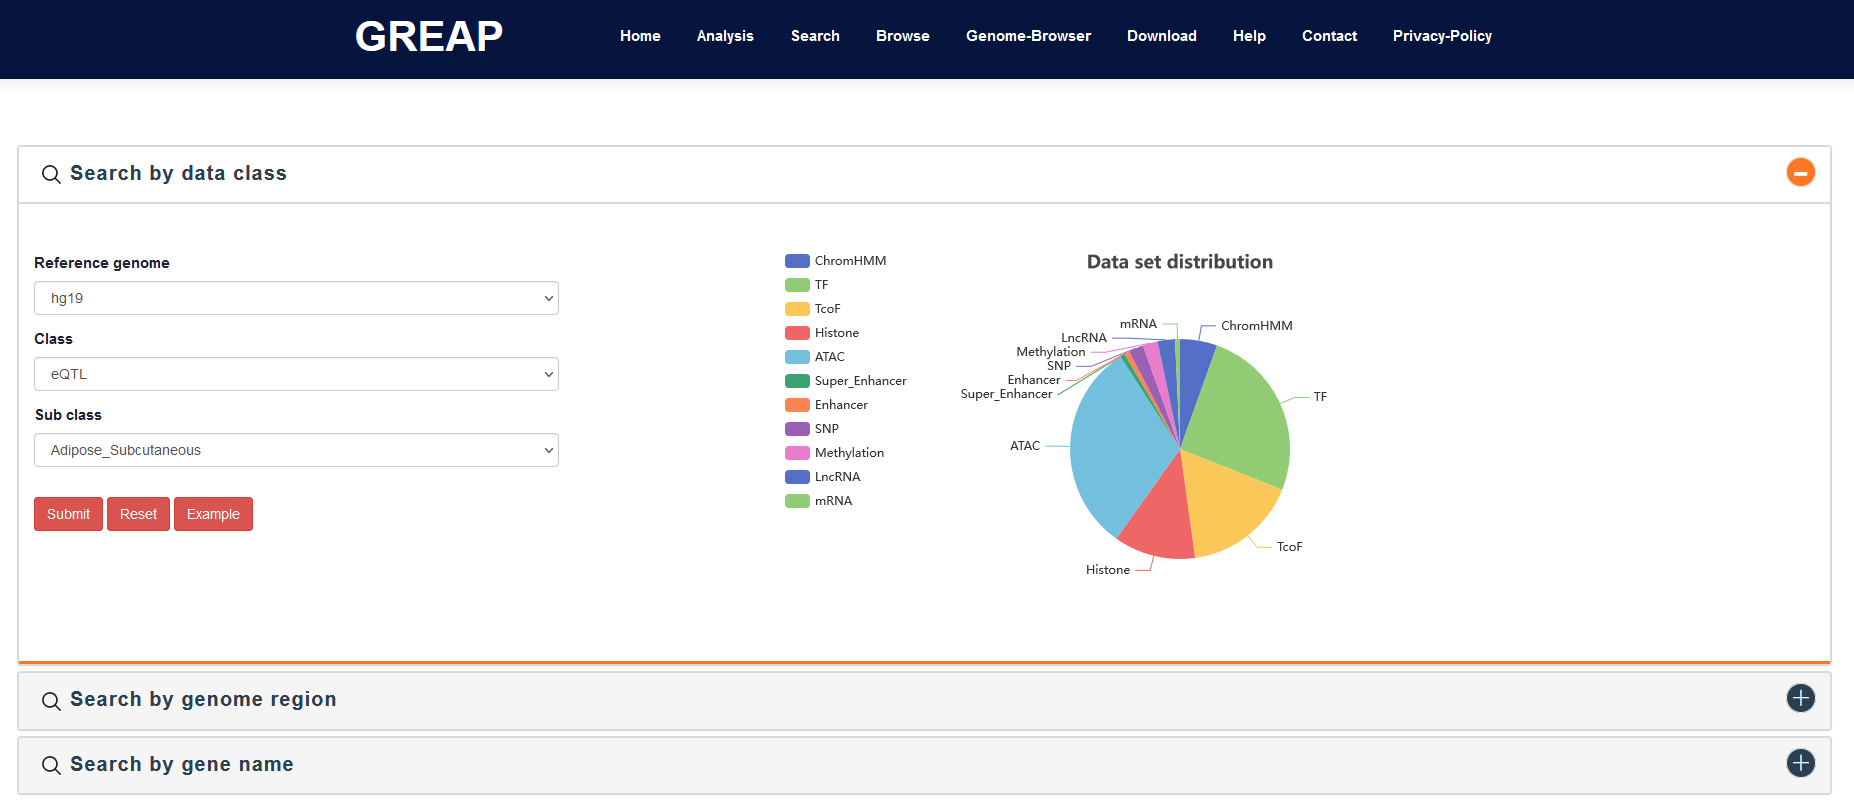
II. Options: Select class and sub class of reference sets and optional parameters for analysis.
III. Analysis: Annotate the input into the reference collections selected by the user, and calculate the significance of enrichment analysis by hypergeometric test or LOLA according to the number of genome region intersecting.
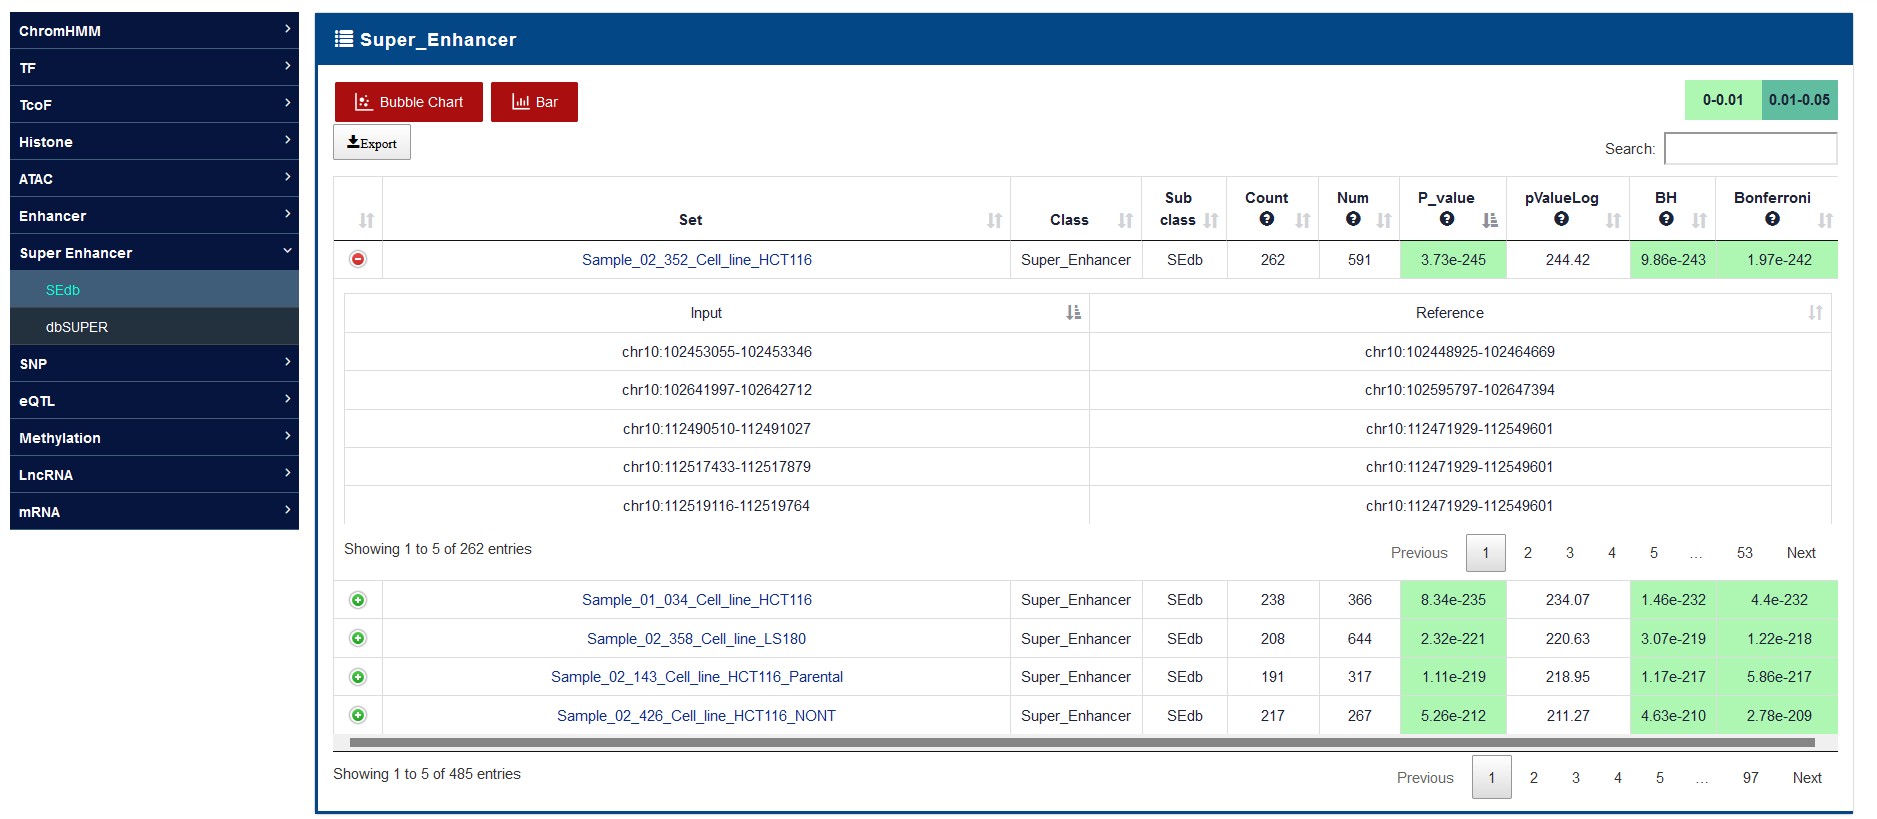
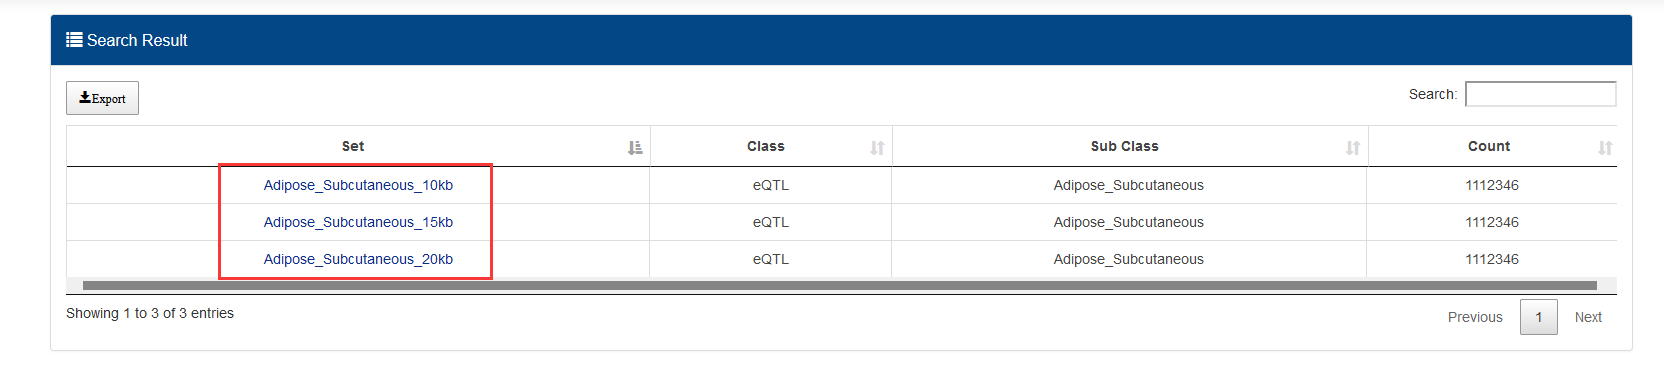
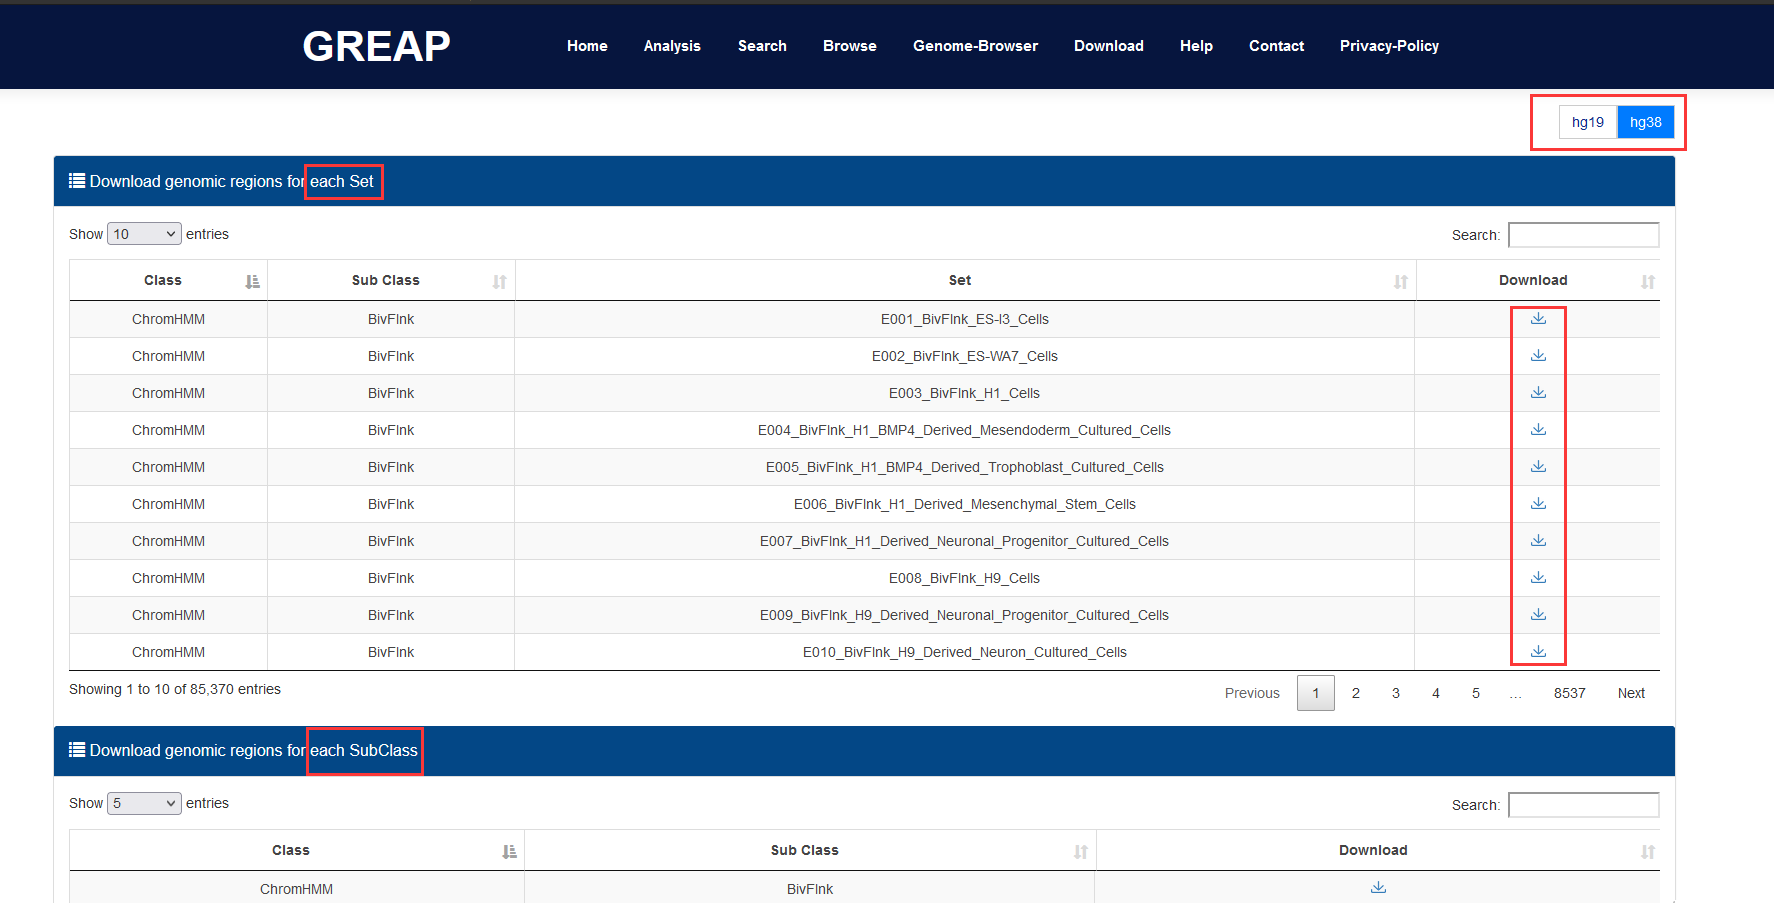
IV. Output: GREAP will return all significant collections information related the input to provide users with download and visualization.
Docker image
If you want to download the docker image of GREAP, please enter the following code in the console of Linux server to install it docker pull greap
GREAP Sets
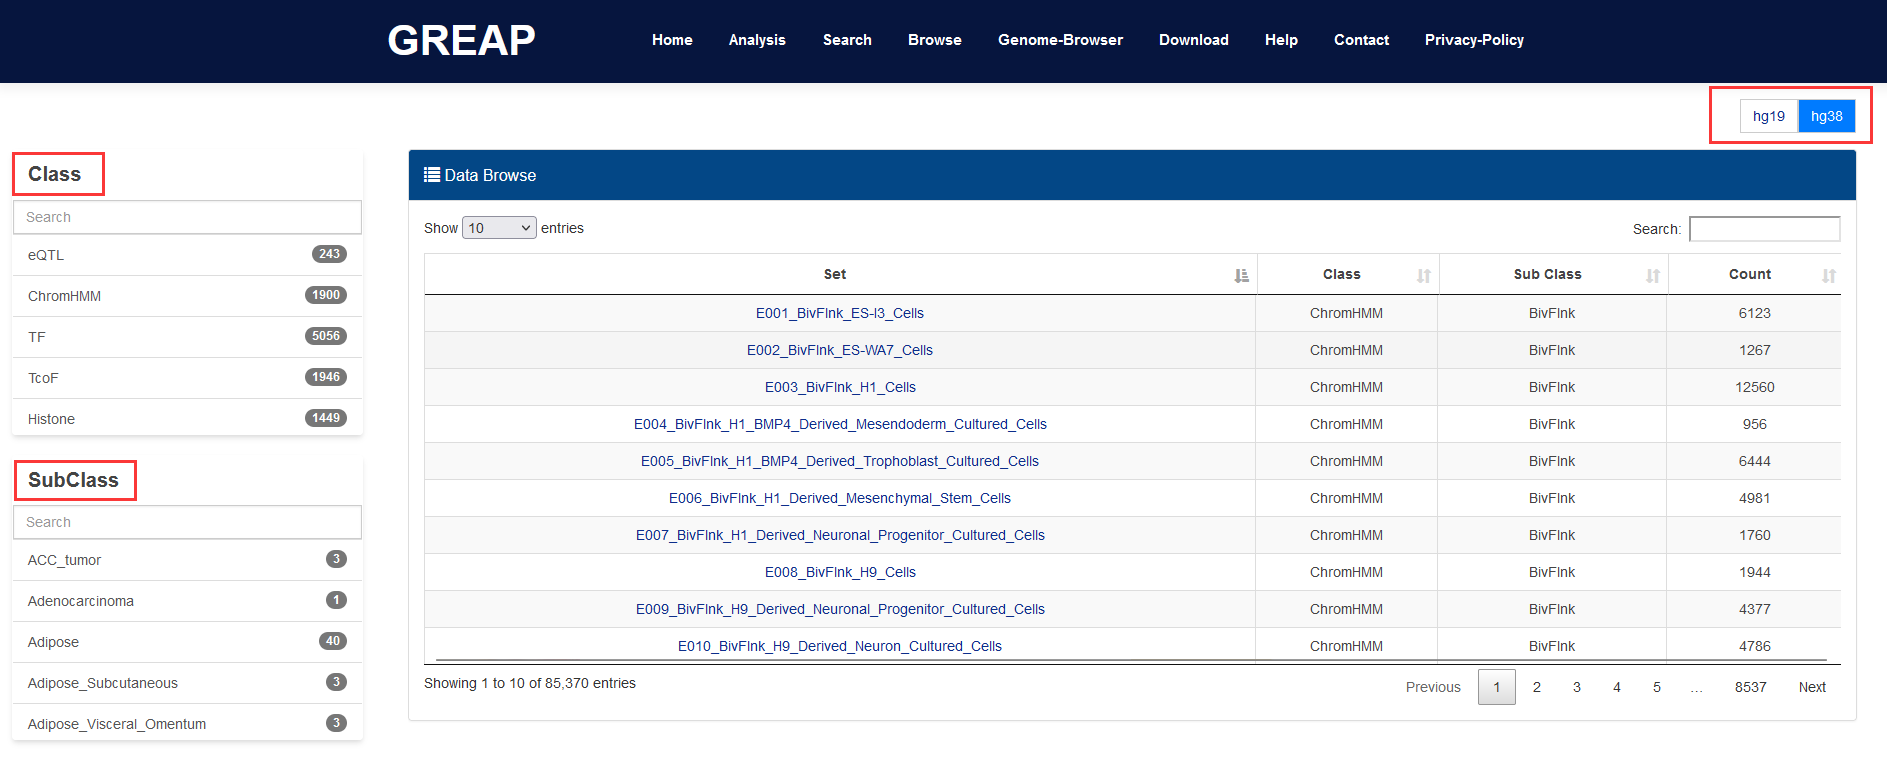
C1: ChromHMM
ChromHMM is an automated computational system for learning chromatin states, and for characterizing their biological functions and correlations with large-scale functional datasets. From multiple chromatin marks, Roadmap uses ChromHMM v1.10, a multivariate Hidden Markov method, to calculate chromatin states across 127 epigenomes. We added the ChromHMM core 15 states of five chromatin marks (H3K4me3, H3K4me1, H3K36me3, H3K27me3, and H3K9me3) to GREAP. The core 15 states are TssA (Active TSS), TssAFlnk (Flanking Active TSS), TxFlnk (Transcr. at gene 5' and 3'), Tx (Strong transcription), TxWk (Weak transcription), EnhG (Genic enhancers), Enh (Enhancers), ZNF/Rpts (ZNF genes & repeats), Het (Heterochromatin), TssBiv (Bivalent/Poised TSS), BivFlnk (Flanking Bivalent TSS/Enh), EnhBiv (Bivalent Enhancer), ReprPC (Repressed PolyComb), ReprPCWk (Weak Repressed PolyComb) and Quies (Quiescent/Low).
C2: TF
As a transcriptional regulator, protein activities of TFs and TcoFs can affect expression of downstream target genes by indirectly occupying DNA regulatory elements, such as promoter regions, enhancer regions, and super enhancer regions. Given the development of high-throughput techniques, ChIP-seq has become an important strategy for identifying the target genes and functions of TFs and TcoFs. We downloaded the TF and TcoF ChIP-seq data from Cistrome and Remap. The TF binding regions information covered over 9,000 samples, including 57 tissue types and 3,328 TFs. The TcoF binding regions information covered more than 3,900 samples, including 41 tissue types and 1,166 TcoFs.
C3: TcoF
As a transcriptional regulator, protein activities of TFs and TcoFs can affect expression of downstream target genes by indirectly occupying DNA regulatory elements, such as promoter regions, enhancer regions, and super enhancer regions. Given the development of high-throughput techniques, ChIP-seq has become an important strategy for identifying the target genes and functions of TFs and TcoFs. We downloaded the TF and TcoF ChIP-seq data from Cistrome and Remap. The TF binding regions information covered over 9,000 samples, including 57 tissue types and 3,328 TFs. The TcoF binding regions information covered more than 3,900 samples, including 41 tissue types and 1,166 TcoFs.
C4: Histone
Histone modification is one of the main means of epigenetic control in biological processes, which is usually located in the free amino terminal tails of four common histones (H2A, H2B, H3, and H4; especially H3 and H4). An increasing number of studies have found that many important biological regulatory elements were generally marked by enrichment of H3K4me1 and H3K27ac, such as poised and active enhancers. Considering that the enrichment of these histone modifications in the genome can be determined by ChIP-seq, we further downloaded histone modifications ChIP-seq data from ENCODE to provide researchers with a means of user-friendly analysis. This ChIP-seq data contains over 1,400 samples covering 33 histone modifications, such as H3K27ac, H3K27me3, and H3K4me1.
C5: ATAC-seq
Accessible chromatin is a highly informative structural feature for identifying regulatory elements, which provides information about transcriptional activities and gene regulatory mechanisms. To characterize accessible chromatin regions in different samples, we downloaded 1,493 ATAC-seq data covering numerous cell/tissue types from NCBI GEO/SRA. We used streamlined pipeline of Bowtie2, SAMtools, and MACS2 to identify accessible chromatin regions and developed ATACdb database. These accessible chromatin regions from different samples are also stored in GREAP as one of reference sets.
C6: Enhancer
Enhancers and super enhancers (SEs) are classes of cis-regulatory elements that can increase gene transcription by forming loops in intergenic regions, introns and exons. SEs have a higher density of core TF and active chromatin markers such as H3K27ac than enhancers. To construct enhancer and SE categories, we integrated H3K27ac ChIP-seq data from NCBI GEO/SRA, ENCODE, Roadmap and GGR (Genomics of Gene Regulation Project), and identified enhancers and SEs involving 542 cells/tissues by the streamlined pipeline of Bowtie, MACS, and ROSE. Detailed SE annotation and regulatory information can be viewed in the SEdb database and SEanalysis web server developed by our team. These enhancer and SE sets serves as "SEdb" sub-category in the "Enhancer" and "Super enhancer" categories, respectively. In addition, we also downloaded more than 65,000 SE regions from dbSUPER, which included 99 cells/tissues. Importantly, many studies have confirmed some enhancers that play an important role in the development of diseases through low-throughput experiments. To obtain such enhancers, we manually reviewed 1,590 published studies and obtained 425 enhancers, stored in ENdb database, simultaneously and took as "ENdb" sub-category of "Enhancer".
C7: Super_Enhancer
Enhancers and super enhancers (SEs) are classes of cis-regulatory elements that can increase gene transcription by forming loops in intergenic regions, introns and exons. SEs have a higher density of core TF and active chromatin markers such as H3K27ac than enhancers. To construct enhancer and SE categories, we integrated H3K27ac ChIP-seq data from NCBI GEO/SRA, ENCODE, Roadmap and GGR (Genomics of Gene Regulation Project), and identified enhancers and SEs involving 542 cells/tissues by the streamlined pipeline of Bowtie, MACS, and ROSE. Detailed SE annotation and regulatory information can be viewed in the SEdb database and SEanalysis web server developed by our team. These enhancer and SE sets serves as "SEdb" sub-category in the "Enhancer" and "Super enhancer" categories, respectively. In addition, we also downloaded more than 65,000 SE regions from dbSUPER, which included 99 cells/tissues. Importantly, many studies have confirmed some enhancers that play an important role in the development of diseases through low-throughput experiments. To obtain such enhancers, we manually reviewed 1,590 published studies and obtained 425 enhancers, stored in ENdb database, simultaneously and took as "ENdb" sub-category of "Enhancer".
C8&C9: SNP&eQTL
GWAS have provided a large amount of data of associating genetic variants with common phenotypes. We collected SNPs from the NHGRI GWAS Catalog. Human eQTL datasets were downloaded and merged from PancanQTL and GTEx. For each eQTL pair, we annotated eQTL with ‘rsID’. Finally, we obtained 1,515,001 SNPs associated with diseases, traits, and phenotypes. From the SNPs affecting the gene expressions, we expanded the SNP sites by 10 kb, 15 kb, and 20 kb upstream and downstream respectively.
C10: Methylation
A total of 198,468,712 methylation sites were collected across 60 samples, including the 450 K array from ENCODE. We divided these sites into hypermethylation and hypomethylation according to beta values. Sites with a beta value over 0.6 were assumed to involve hypermethylation, while sites were considered hypomethylation with a beta value greater than 0.2 and less than 0.6. We expanded the methylation sites by 10 kb, 15 kb, and 20 kb upstream and downstream respectively.
C11: LncRNA
We collected data for multiple categories of lncRNA sets including Disease, Drug, Subcellular Localization, Cancer Hallmark, SmORF, Exosome and Cell Marker from LncSEA, which is a comprehensive human lncRNA sets resource and enrichment analysis platform developed by our team. For mRNA sets, we collected from CellMarker, GOterm and GTEx. Finally, we obtained regions between 2 kb, 5 kb, and 10 kb upstream and 1 kb downstream of the gene transcription start sites as promoter regions based on annotation file from GENCODE.
C12: mRNA
We collected data for multiple categories of lncRNA sets including Disease, Drug, Subcellular Localization, Cancer Hallmark, SmORF, Exosome and Cell Marker from LncSEA, which is a comprehensive human lncRNA sets resource and enrichment analysis platform developed by our team. For mRNA sets, we collected from CellMarker, GOterm and GTEx. Finally, we obtained regions between 2 kb, 5 kb, and 10 kb upstream and 1 kb downstream of the gene transcription start sites as promoter regions based on annotation file from GENCODE.